Did-Apps
Apps for teaching and learning
AccelVisu - Representation of the acceleration vector
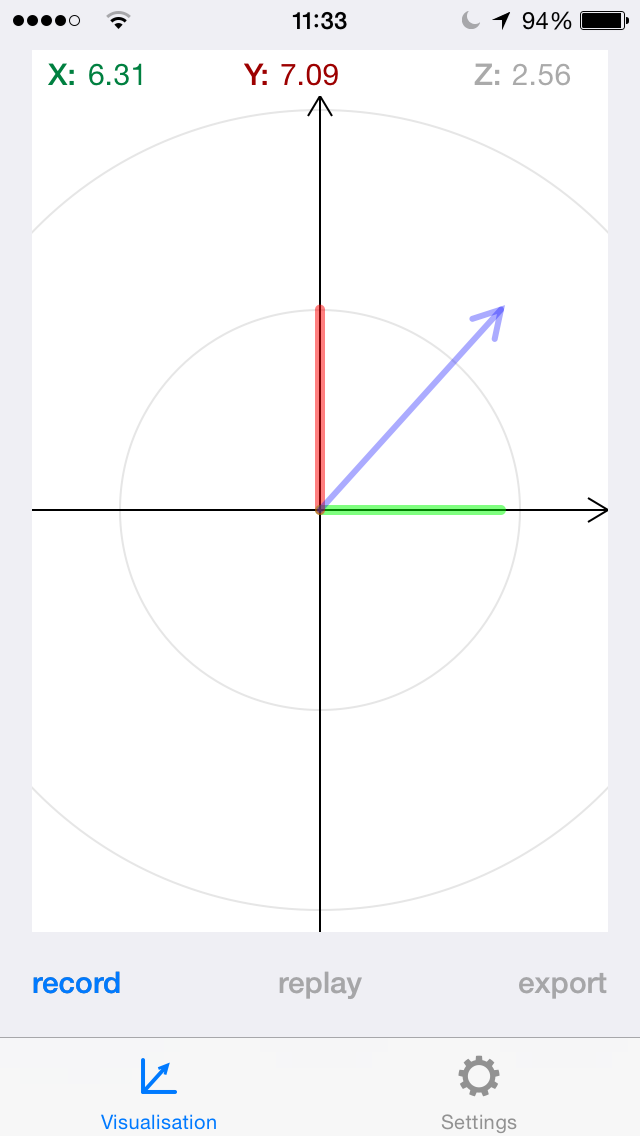
With this program, the values of the built-in accelerometer are read out and the acceleration is displayed as a vector.
After starting the program, it displays a coordinate system by displaying the XY projection of the measured acceleration as an arrow. In addition, the X and Y components of the measured acceleration are each displayed as lines (green and red) in the direction of the axes.
Above the coordinate system is the display of the instantaneous acceleration magnitude in m/s².
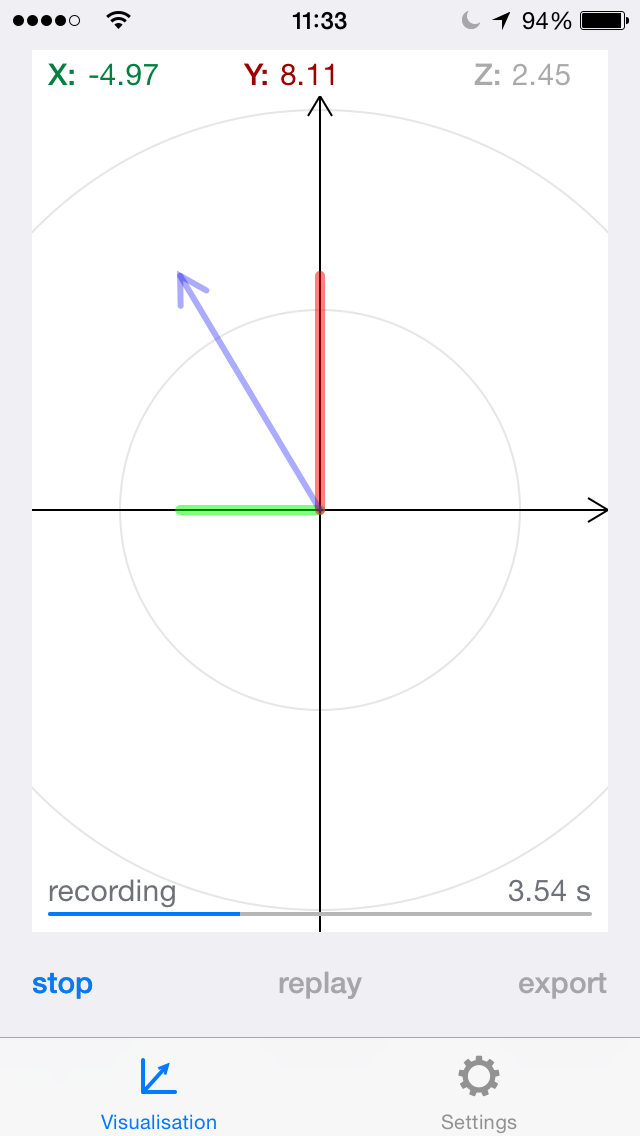
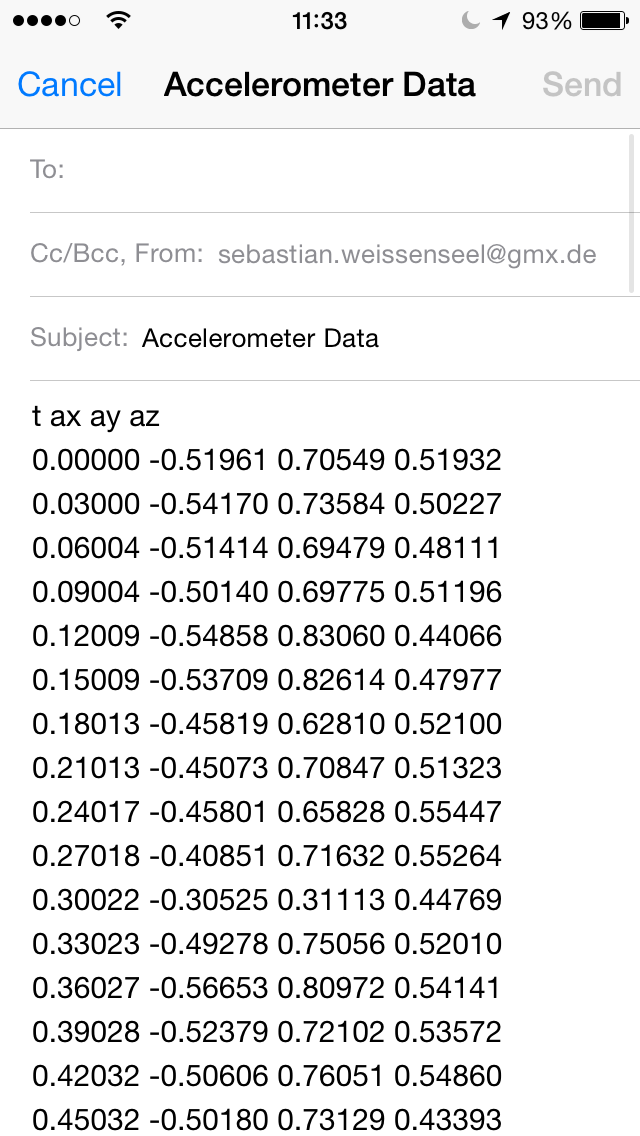
By pressing the "Recording" button, you can record the acceleration values and then display them again using the "Play" button. Via the button "Export" you can send an email with the data in text form.
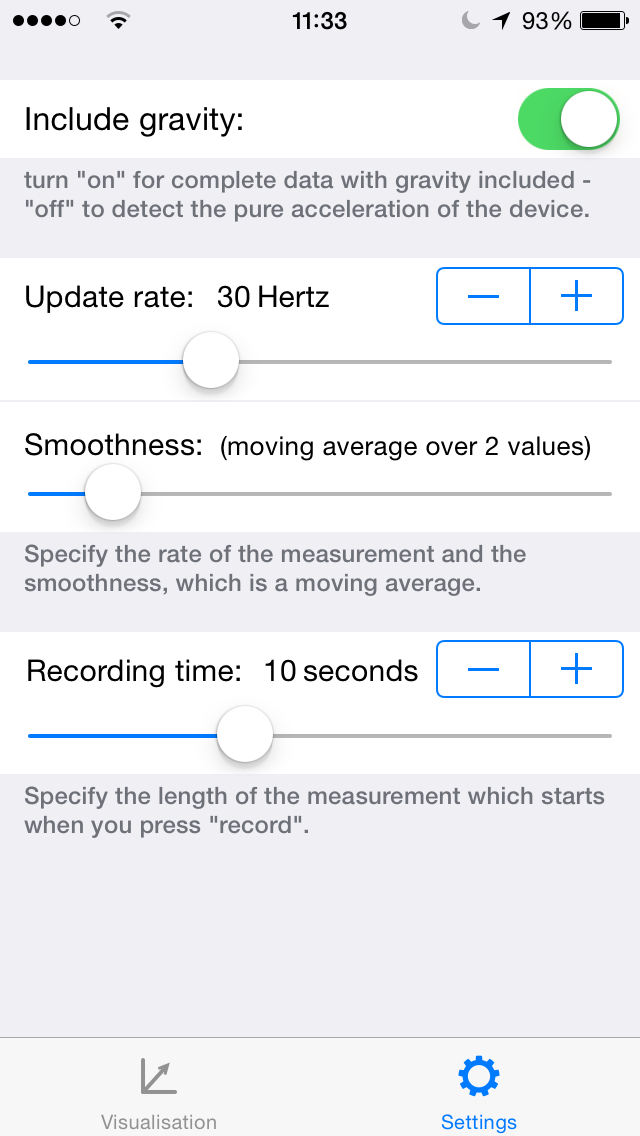
In the lower bar, you can access the configuration options via "Settings". There you can adjust the measurement frequency, recording time, and softness to suppress small fluctuations. Similarly, the influence of gravity can be switched off via a slide switch.
Further information and application examples can be found in the article:
T. Wilhelm, J.-P. Burde, S. Lück - The direction of acceleration
The Physics Teacher 53, Nr. 8, 2015, S. 500 – 501, doi: 10.1119/1.4933157